
When it comes to the quality of a machined or finished surface, there will always be two relevant terms: surface roughness and surface finish. Although they are often used interchangeably, they are not scientifically the same with distinct differences.
Surface roughness refers to the quantifiable measurement of the irregularities on a surface, while surface finish is a qualitative assessment based on its appearance or indirectly from the roughness value. However, in machine shops, it is common for the term surface finish to be used to describe only the surface roughness.
This article will focus on the difference between surface roughness and surface finish in terms of their attributes, value, measurement, and features. Additionally, it will provide a chart of typical roughness achieved in some common manufacturing processes and a common surface roughness conversion chart for reference. Let’s move on to learn more.
What is Surface Roughness?
Surface roughness, also known as roughness, is a critical aspect of surface finish that is commonly specified, measured, and calculated. It is defined by the variations in the direction of the normal vector of an actual surface compared to its ideal form. When these variations are significant, the surface is considered rough, whereas if they are minimal, the surface is considered smooth.
In surface metrology, roughness is typically associated with the high-frequency and short-wavelength components of a measured surface. However, in practical applications, it is often necessary to consider both the amplitude (size of the deviations) and frequency (how frequently they occur) to determine whether a surface is suitable for its intended purpose.
What is Surface Finish?
Surface finish refers to the texture of a surface and is often used interchangeably with the term surface texture. It consists of three main components: roughness, lay, and waviness. The surface finish of manufactured products can vary greatly, based on the materials and processes employed during production.
Specifications for surface finish are commonly indicated on technical drawings for mechanical parts, especially in cases where parts need to fit tightly together, interact with one another, or create a seal. In order to properly specify and interpret surface texture symbols in technical drawings, the ASME (American Society of Mechanical Engineers) has published the Y14.36M Surface Texture Symbols standard. The ASME also publishes the B41.6 Surface Texture Standard, which provides definitions and measurement methods for surface finish.
Clear and effective communication of surface requirements is vital for ensuring that the final product meets the desired performance standards. Failing to include, accurately specify, or properly interpret surface finish requirements can have significant consequences on the performance and cost of the end product.
Different Surface Finishes
In general, when a high level of purity is required in a product, the manufacturing equipment must have a finer surface finish. For instance, the 2B finish is commonly utilized in baking equipment, food processing, pharmaceutical equipment, vacuum drum dryers, and tanks and vessels. This finish is considered to be smooth, or in some cases, even smoother than a polished #4 finish, and both are acceptable in meeting USDA standards. The average roughness (Ra value) for a 2B finish typically ranges from 0.3 (12) to 1µ (40), depending on the gauge of the metal.
Here are some other finishes and their corresponding roughness averages for comparison:
- A #1 finish, also known as Hot Rolled, Annealed, and Pickled (HRAP), is the initial state of plate material when it leaves the mill. It has a very rough surface, typically ranging from 3.2 (125) to 12.5 (500) Ra, and has not undergone any mechanical finishing processes such as abrasive application.
- A #4 finish is a straight-grained finish often referred to as a “brushed” finish, along with #3 and #6 finishes. A standard #4 finish usually has a Ra value of about 0.8 (32), while a #4 Dairy or Sanitary finish has a roughness average between 0.3 (12) Ra and 0.4 (16) Ra.
- Two other finishes, #7 and #8, are buffed finishes. The surface of a #8 finish is nearly flawless, with an extremely low Ra value of 0.025 (1) Ra.
While there are many other available finishes, for bio-pharmaceutical applications such as injectables and otic solutions, a surface finish of around 0.38 (15) Ra with electropolishing is typically specified and compliant with BPE SF-4 standards. Powder and tablet manufacturers may be able to utilize a slightly rougher surface finish of about 0.5 (20) Ra under the BPE SF-2 standards, as it does not require electropolishing.
Difference between Surface Roughness and Surface Finish
Surface finish consists of three main elements: roughness, lay, and waviness. Among these, roughness is the aspect of surface finish that is most commonly specified.
Roughness refers to the measurement of both macro and micro asperities and irregularities present on a finished surface after machining. It provides a quantitative indication of the height of peaks and the depth of valleys of these surface asperities. To measure roughness, there are various instruments available that facilitate accurate measurement.
In contrast, surface finish qualitatively describes and designates the overall appearance and quality of a surface. This can be done by visually observing the surface or by considering the roughness value. Descriptive attributes such as bad, poor, good, glossy, fine, etc., are used to characterize the finish quality. Unlike roughness, surface finish does not yield numerical values, and it can be influenced by subjective human perception.
This table summarizes the key differences between surface roughness and surface finish.
| Surface Roughness | Surface Finish |
| Quantitative measurement of surface irregularities | Qualitative assessment of surface quality |
| Provides numerical values for peak height and valley depth | Described by attributes like bad, poor, good, glossy, fine, etc. |
| Measured using specific instruments | Determined visually or based on roughness value |
| Objective measurement | Subjective assessment |
| Helps to evaluate functional aspects, such as friction and wear | Indicates the overall appearance and aesthetic appeal of the surface |
Quantitative and qualitative value
All physical parameters can be measured and their values are represented using numerical values and corresponding units. Quantitative measurements always provide numeric values along with units. Surface roughness is an example of a measurable parameter. For instance, the average roughness of a micro-milled surface is 325 nanometers. On the other hand, finish is a qualitative parameter that cannot be expressed using numerical values. Instead, attributes such as good, bad, poor, rough, etc. are used to describe the finish.
Subjective parameter and human perception
Surface finish attributes are subjective and rely on the specific application or desired outcome. For example, a milled surface that is considered to have a good finish for a casing may be viewed as having a poor finish if it is intended for use in a ball-bearing. However, the roughness remains the same regardless of the application. It is independent of the application and unaffected by human bias. Since humans have varying preferences, what one person considers a good finish, another person may not. Therefore, the attributes used to describe surface finish have limited applicability in a scientific context.
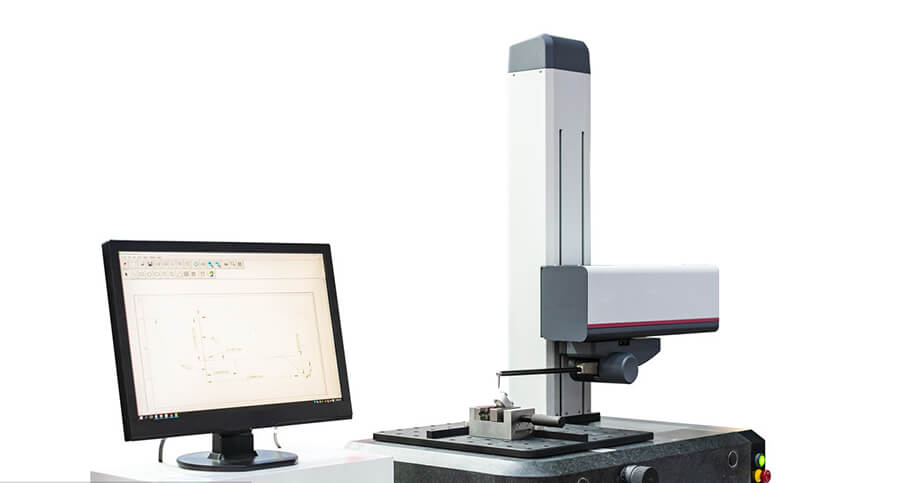
Measuring instrument
Surface roughness can be accurately measured using various instruments, both contact and non-contact types, that are easily accessible in the market. These instruments come with different features and capabilities. Regardless of the specific measuring instrument used, roughness is essentially a measurement of the height of peaks and the depth of valleys on the surface of an object. On the other hand, surface finish cannot be directly measured using instruments. Instead, the value of surface roughness is used as an indirect indicator to specify the finish of a surface.
Evaluation using other parameters
Various manufacturing processes produce different levels of surface finish. Typically, processes such as machining, which involve surface generation, and surface modification techniques like heat treatment, coating, and coloring, tend to result in lower roughness. However, newer and more advanced processes like powder metallurgy and investment casting can also provide high-quality surfaces. Estimating roughness can be done by considering various process parameters and relevant instrument features used in the process. For instance, in machining with a sharp tool, the estimated roughness can be expressed using parameters such as feed rate, principal and auxiliary cutting edge angle. However, surface finish cannot be estimated in the same manner.
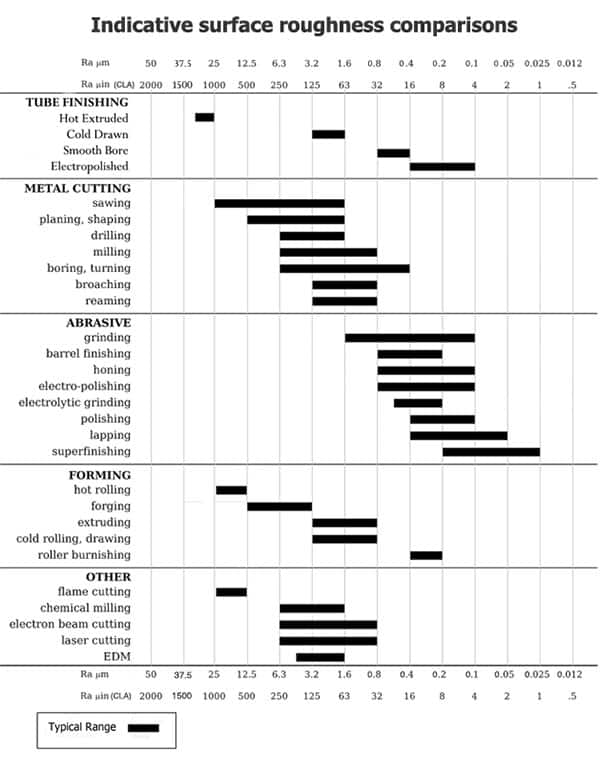
Surface Roughness Comparison Chart – Ra Value for Different Machining Processes
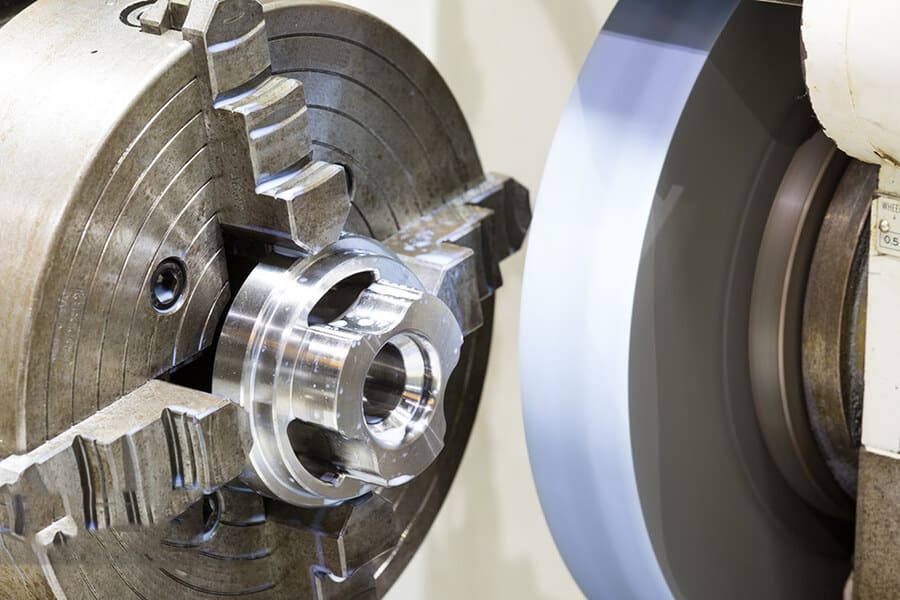
The quality of the surface finish of a part is greatly influenced by the manufacturing process used, and achieving very smooth finishes often requires additional steps like grinding or polishing. It’s important to ensure that the roughness specifications fall within the limitations of the primary manufacturing process.
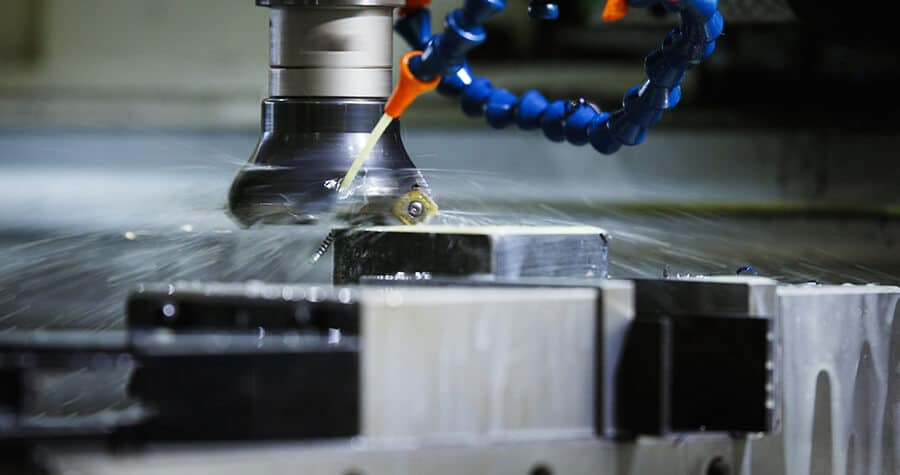
Some manufacturing processes offer a certain level of control over the surface finish within the capabilities of the equipment. For instance, in milling or turning operations, using shallow cutting depths and slow feed speeds typically results in smoother finishes, whereas deeper cuts and faster speeds yield rougher finishes. The condition of the cutting tools can also impact the surface finish.
The picture below exhibits the relative surface roughness of common manufacturing processes:
Surface Roughness Conversion Chart
Here is a conversion chart on common surface roughness:
| Grit No. | Roughness, N | Roughness values, Ra | RMS (µin.) | Center line avg., CLA | Roughness, Rt | |
| ISO No. | micrometers (µm) | microinches (µin.) | (µin.) | (µm) | ||
| ---- | N12 | 50 | 2000 | 2200 | 2000 | 200 |
| ---- | N11 | 25 | 1000 | 1100 | 1000 | 100 |
| ---- | N10 | 12.5 | 500 | 550 | 500 | 50 |
| 60 | N9 | 6.30 | 250 | 275 | 250 | 25 |
| ---- | N8 | 125 | 137.5 | 125 | 13 | |
| 80 | ---- | 1.80 | 71 | 78 | 71 | 9.0 |
| ---- | N7 | 1.60 | 63 | 64.3 | 63 | 8.0 |
| 120 | ---- | 1.32 | 52 | 58 | 52 | 6.6 |
| 150 | ---- | 1.06 | 42 | 46 | 42 | 5.3 |
| ---- | N6 | 0.80 | 32 | 32.5 | 32 | 4.0 |
| 180 | ---- | 0.76 | 30 | 33 | 30 | 3.8 |
| 220 | ---- | 0.48 | 19 | 21 | 19 | 2.4 |
| ---- | N5 | 0.40 | 16 | 17.6 | 15 | 2.0 |
| 240 | ---- | 0.38 | 15 | 17 | 12 | 1.9 |
| 320 | ---- | 0.30 | 12 | 14 | 9 | 1.5 |
| 400 | ---- | 0.23 | 9 | 10 | 8 | 1.3 |
| ---- | N4 | 0.20 | 8 | 8.8 | 4 | 1.2 |
| 500 | N3 | 0.10 | 4 | 4.4 | 2 | 0.8 |
| ---- | N2 | 0.05 | 2 | 2.2 | 1 | 0.5 |
| ---- | N1 | 0.025 | 1 | 1.1 | 1 | 0.3 |
Surface Roughness Symbols: Ra vs Rz
Both Ra and Rz are measurements used to quantify surface roughness, but they differ in their specific meanings and calculations.
Ra, or average surface roughness, represents the average distance between the peaks and valleys on a surface, as well as the deviation from the mean line within a specified sampling length. It provides an average value of the roughness over the measured area.
On the other hand, Rz, or the average maximum height of the profile, measures the largest difference between the highest peak and the lowest valley within a set of five sampling lengths. It indicates the maximum variation in height on the surface.
While Ra provides an average measurement, it may not fully capture the specific surface features of a tested part. In some cases, surfaces that are processed using different methods can have the same Ra value. To address this limitation, Rz is sometimes used to eliminate errors and provide a more comprehensive evaluation of surface roughness.
Ra Value for Different Materials in Machining
The surface finish requirements for various materials in CNC machining depend on factors like the machining process, cutting speed, tool shape, depth of cut, and more. Here are some typical ranges for common metals:
- Steel: The Ra values for steel can vary from 0.2 µm to 3 µm, depending on the specific machining process. For instance, turning usually results in Ra values between 0.4 µm and 1 µm, while grinding can achieve even lower Ra values of around 0.2 µm.
- Aluminum: Aluminum generally has lower Ra values compared to steel, ranging from 0.1 µm to 1 µm. Turning and milling processes typically produce Ra values between 0.2 µm and 0.5 µm, while grinding can achieve Ra values as low as 0.1 µm.
- Copper: Ra values for copper fall within the range of 0.1 µm to 1 µm. Turning and milling processes usually yield Ra values between 0.2 µm and 0.5 µm, while grinding can achieve Ra values as low as 0.1 µm.
- Titanium: Titanium tends to have higher Ra values compared to steel, ranging from 0.5 µm to 4 µm. Turning and milling processes generally result in Ra values between 0.8 µm and 1.5 µm, while grinding can achieve Ra values as low as 0.5 µm.
When to use the Rz value?
The Rz value should be used in the following situations:
- For surfaces that are extremely rough or smooth, taking into account the working and testing conditions, it is recommended to use Rz to get a more accurate evaluation of the surface roughness.
- When working with soft materials, Rz should be used instead of Ra. This is because Ra measurements, which involve needle tracing, can scratch the surface of soft materials and lead to inaccurate results.
- If the measurement area is very small and has fewer than 5 internal contour peaks or valleys within the sampling length, Rz should be utilized for measuring the surface roughness.
- When dealing with parts that have fatigue strength requirements, Rz is a suitable parameter to consider for assessing the surface finish.
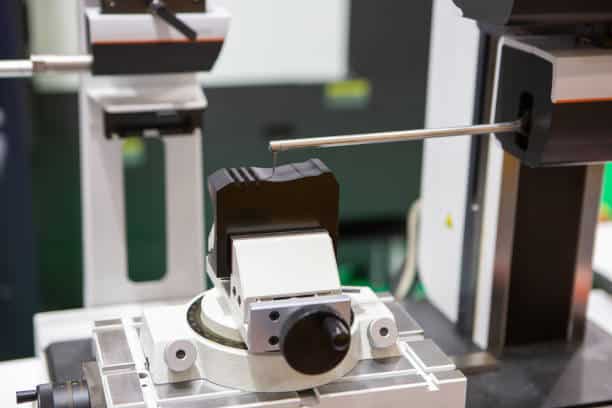
How to Measure Surface Roughness?
Surface roughness refers to how much a surface deviates from its desired shape. It is commonly measured using a variety of methods.
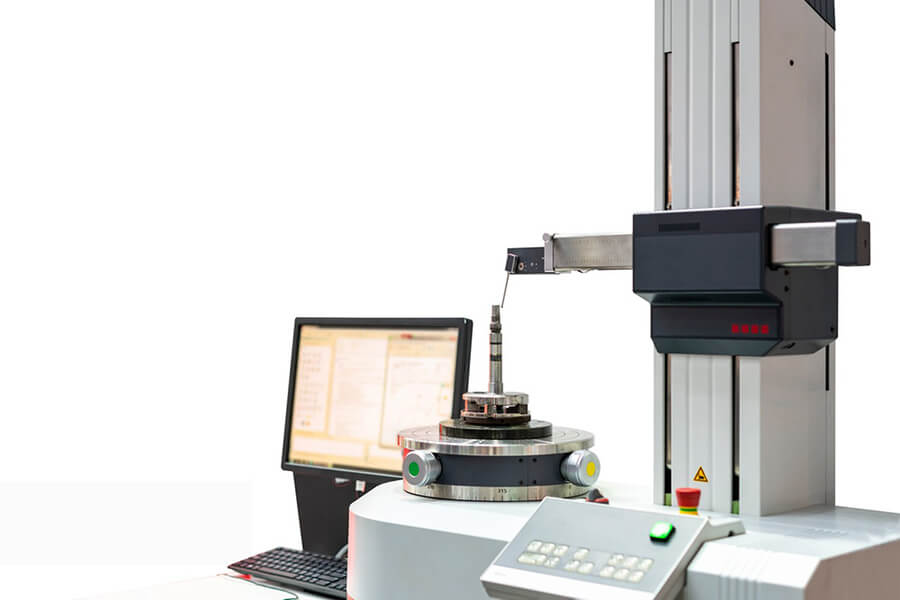
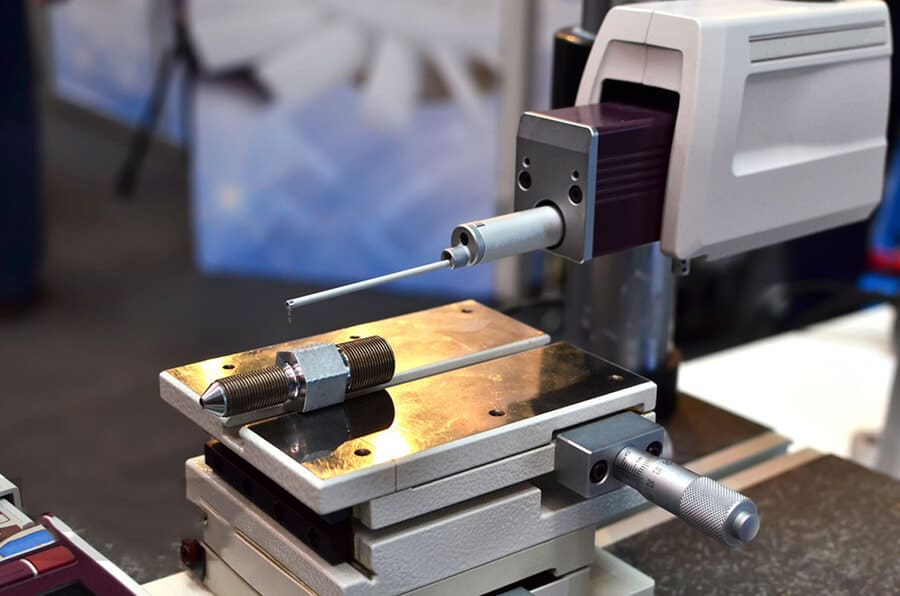
Contact Methods: involve using a probe that makes physical contact with the surface to measure its roughness. The most common contact method is the stylus method, where a stylus is moved across the surface and any deflection is measured and recorded.
Non-contact Methods: used to measure surface roughness without physical contact. These methods typically involve scanning the surface using techniques like lasers or optical systems, and the roughness is determined based on the reflected or scattered light. The optical method is a common non-contact approach where light is projected onto the surface and the reflected light is measured to assess the roughness.
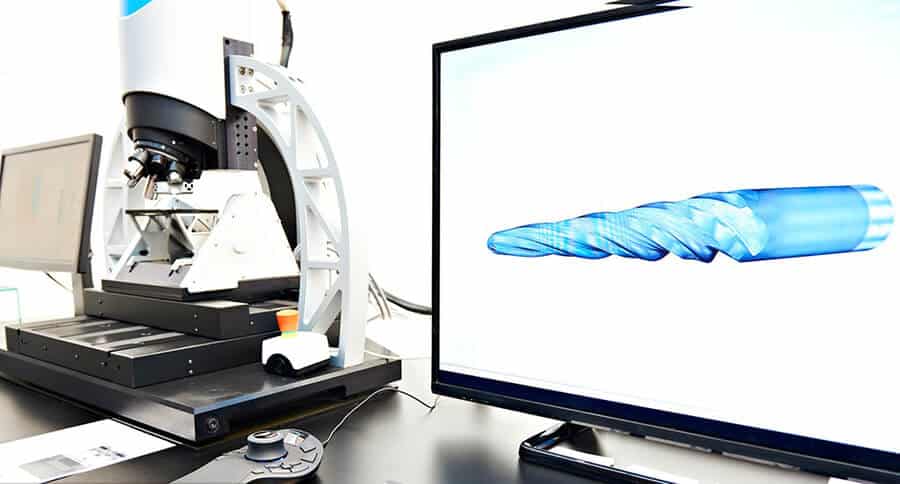
Image Analysis: it captures images of the surface using a camera or microscope and analyzes them to measure surface roughness. This method is particularly useful for surfaces that have intricate details or fine features that cannot be effectively measured using other methods.
In-process methods: enable the real-time monitoring of the surface during machining or other processes, allowing operators to receive valuable feedback. These methods may offer more precise results compared to other techniques because they measure the surface under conditions that closely resemble the actual application.
Comparison techniques: use surface roughness samples that are created using the same equipment, process, and material as the surface being evaluated. These samples are visually and tactilely compared to a known standard of surface roughness. These methods are often used in non-critical applications, as the process relies on subjective judgment.
The Significance of Surface Roughness in Manufacturing
Firstly, surface roughness is a key element of surface texture and has a significant impact on how an object interacts with its environment. The presence of irregularities on a surface can create points where cracks or corrosion can occur, affecting the performance and durability of mechanical components.
In the field of tribology, rough surfaces tend to experience more wear and higher friction coefficients compared to smooth surfaces. This helps manufacturers choose suitable materials and surface finishes for different applications, optimizing the performance and longevity of their products.
Additionally, surface roughness can also be intentionally manipulated to achieve specific outcomes. For example, in applications where adhesion is desired, such as painting, powder coating, or plating, a certain level of roughness can help promote better adhesion of the coatings.
For manufacturers and engineers, maintaining control over surface roughness is crucial. This involves monitoring and measuring the surface roughness to ensure that it falls within specified limits. By doing so, manufacturers can achieve consistent and reliable production processes, leading to high-quality products that meet customer requirements.
FAQs
Conclusion
The desired surface quality is a crucial aspect of machined parts. Surface finish is the specific procedure implemented to achieve the desired level of surface roughness on a fabricated part. It is a critical factor that influences the functionality, appearance, and longevity of the final product, being influenced by the manufacturing processes employed.
Among parameters used to specify surface finish, roughness is the most specifically considered. A high roughness value can lead to elevated friction and premature failure of a part. Thus, it is vital to have a comprehensive understanding of surface finish and surface roughness, as well as their variations.
Custom Quality Surface Finishing Solution Provider – Runsom Precision
When it comes to the manufacturing process, we tend to prioritize factors like the composition of a part, its strength, dimensions, and tolerances. However, surface roughness is also a critical factor to take into account. Having a surface that is too rough can lead to increased friction and premature failure of the part.
Achieving precise surface roughness can be challenging and costly. This is where a professional finishing team can help. At Runsom Precision, we provide one-stop machining solutions to meet your needs, whether you require custom precision CNC machining services or high-quality surface finishing. Our expertise extends to various materials such as aluminum, titanium, stainless steel, brass, and copper, as well as plastic, rubber, silicone, and ceramic parts.
To discuss your project requirements and determine the most suitable machining process and surface finish for your products, request an instant quote or reach out to our experts. We’re here to assist you in achieving optimal results for your projects.
Other Articles You May Be Interested in: